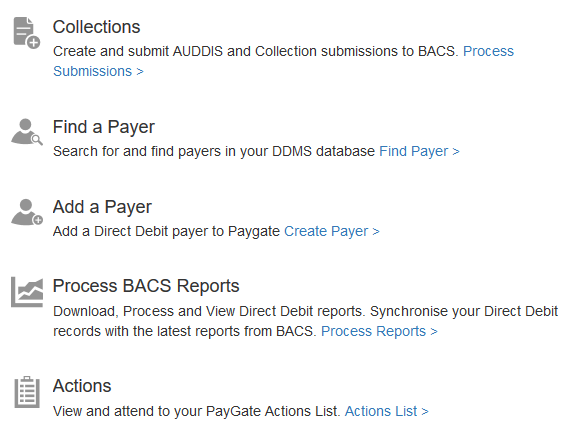
The PayGate DDMS Dashboard is a designed to be a convenient starting page for quickly viewing the status of the DDMS.
You can get to the dashboard by choosing 'DDMS Dashboard' from the Collections Menu.
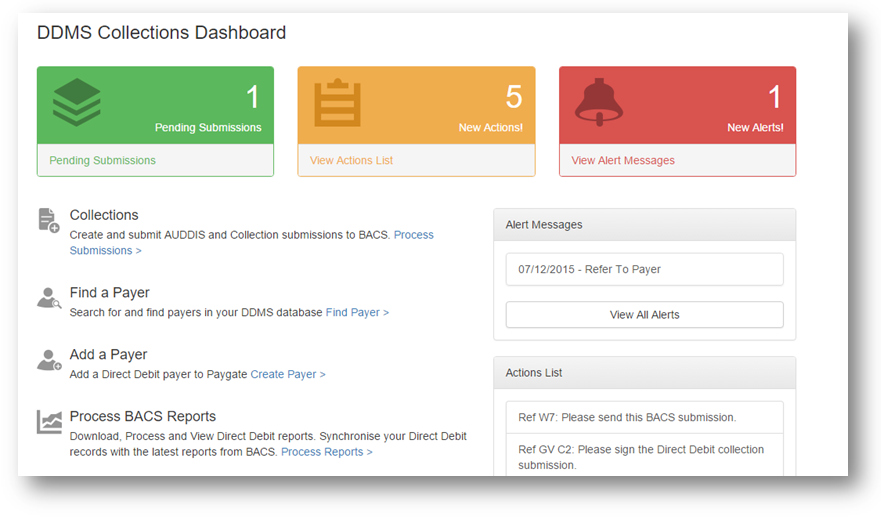
The DDMS Dashboards consists of a number of useful sections
Pending Submissions
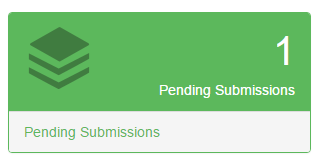
This displays the number of pending submissions that the currently logged in user is capable of creating. To arrive at the figure (the above image shows 2 pending submissions) the DDMS has inspected the schedules of all of the currently loaded payers and calculated whether their collections are due. A submission will only be added to the displayed value if the currently logged in user is capable of creating the submission - that is they have the create roll for the group that contains the collections.
If a user can clicks anywhere on the 'pending Submissions' section they will be taken to the Pending Submissions page where the submission process can begin.
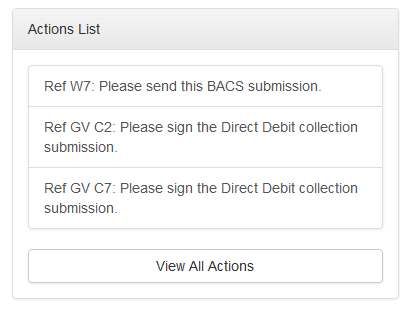
Actions
Alerts
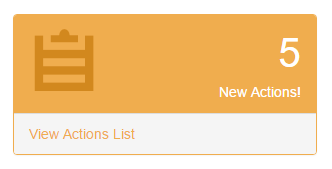
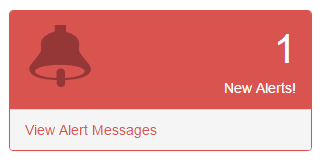
The dashboard shows that total number of active alerts for the currently logged in user. The box at the top is design to give a quick overview of the number of alerts. The user can click anywhere on the red alerts box to be taken to the alerts page so they they can drill down into the specific alerts and carry out any resulting actions.
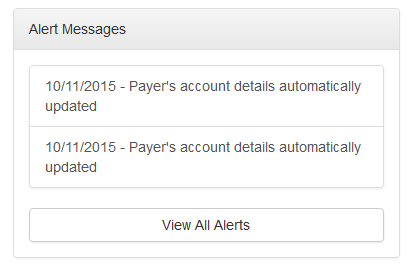
Also in the dashboard is a scaled down grid of active alerts. This is a copy of the alert page mentioned above and is part of the dashboard for convenience. A user can click the individual alert message items to be taken directly to the relevant alert details page.
Common Links Panel
The common links panel provide quick links to many of the commonly use features in the DDMS. Users can click either the blue link or the icon to be immediately transferred to the selected page.
